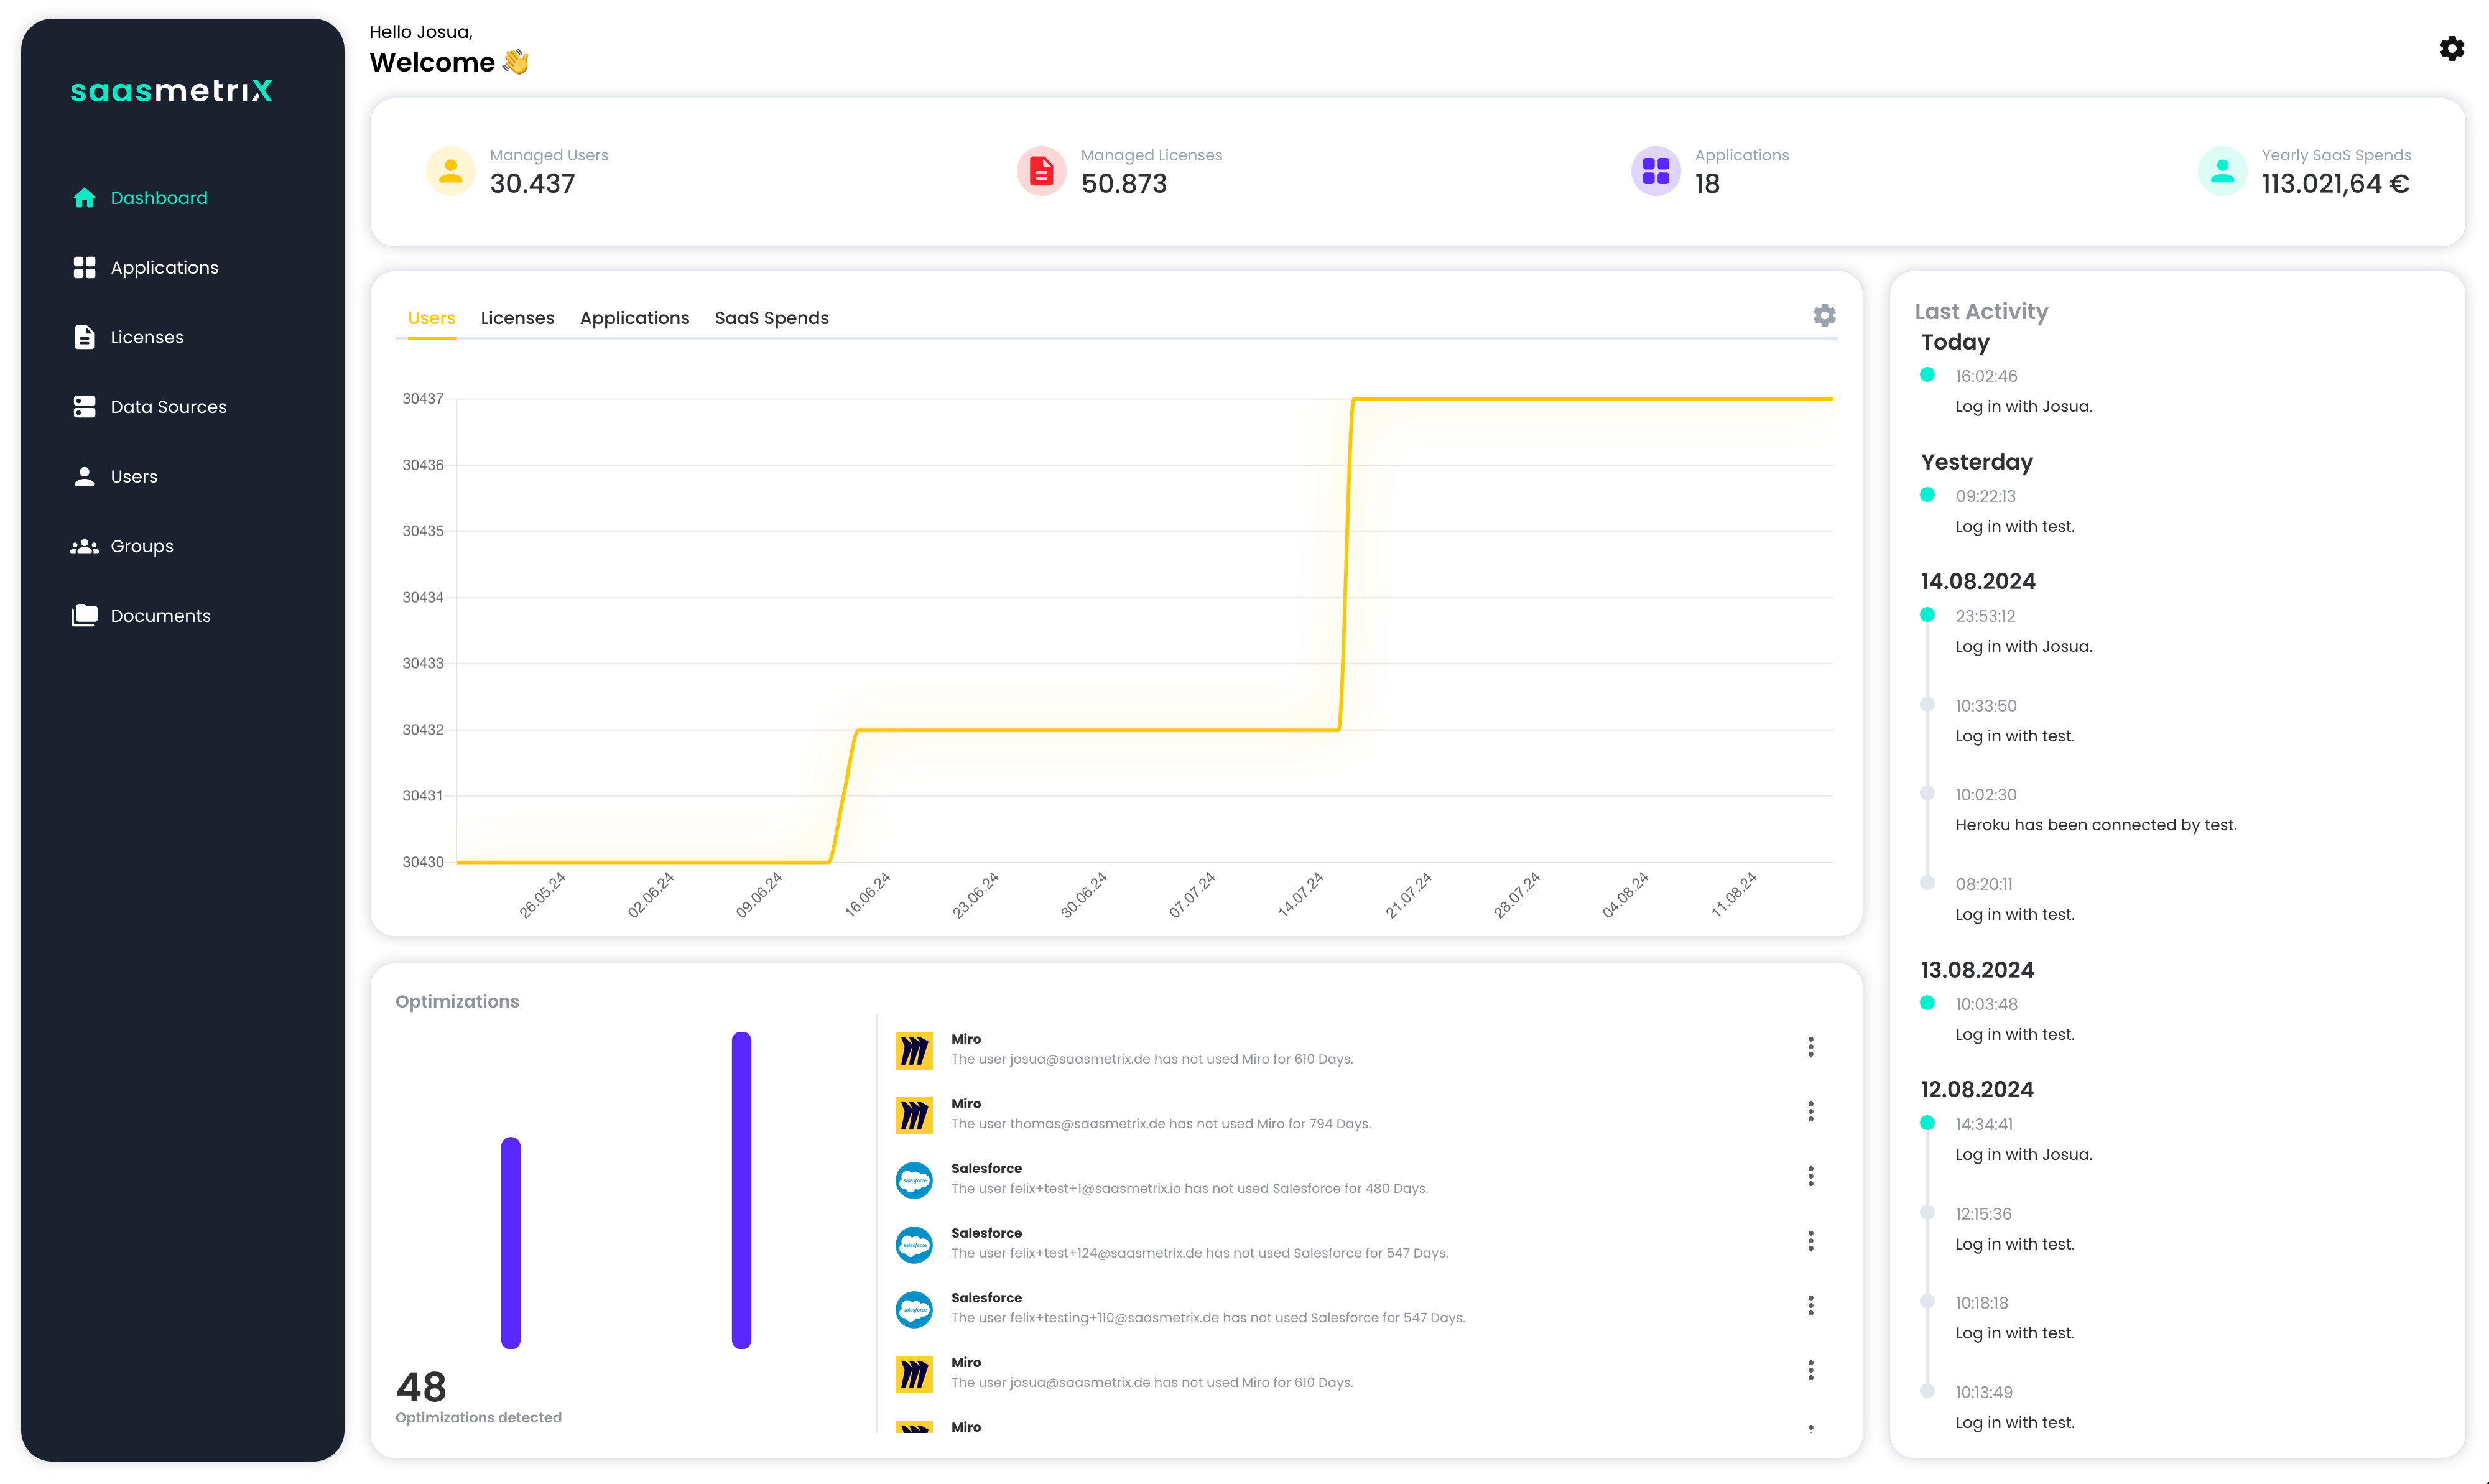
Dashboard
The dashboard displays key metrics for the company's licenses. This includes KPIs, historical data, activities and optimizations.
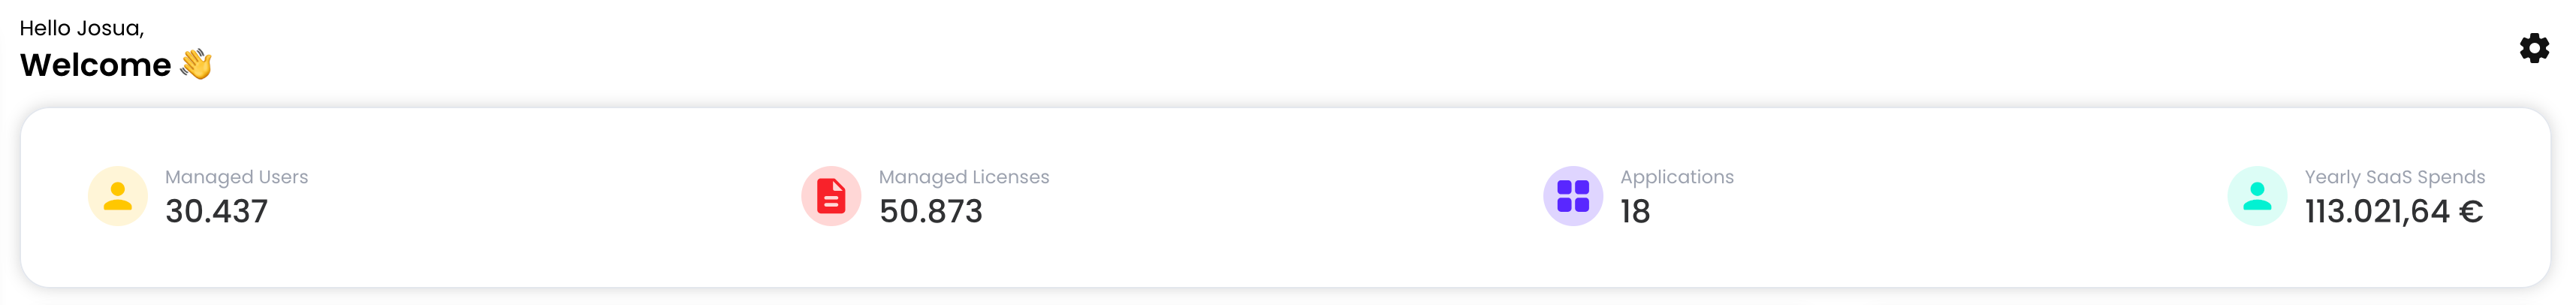
KPIs
The dashboard provides an overview of total annual costs, users and licenses managed, and optimizations identified by saasmetrix.
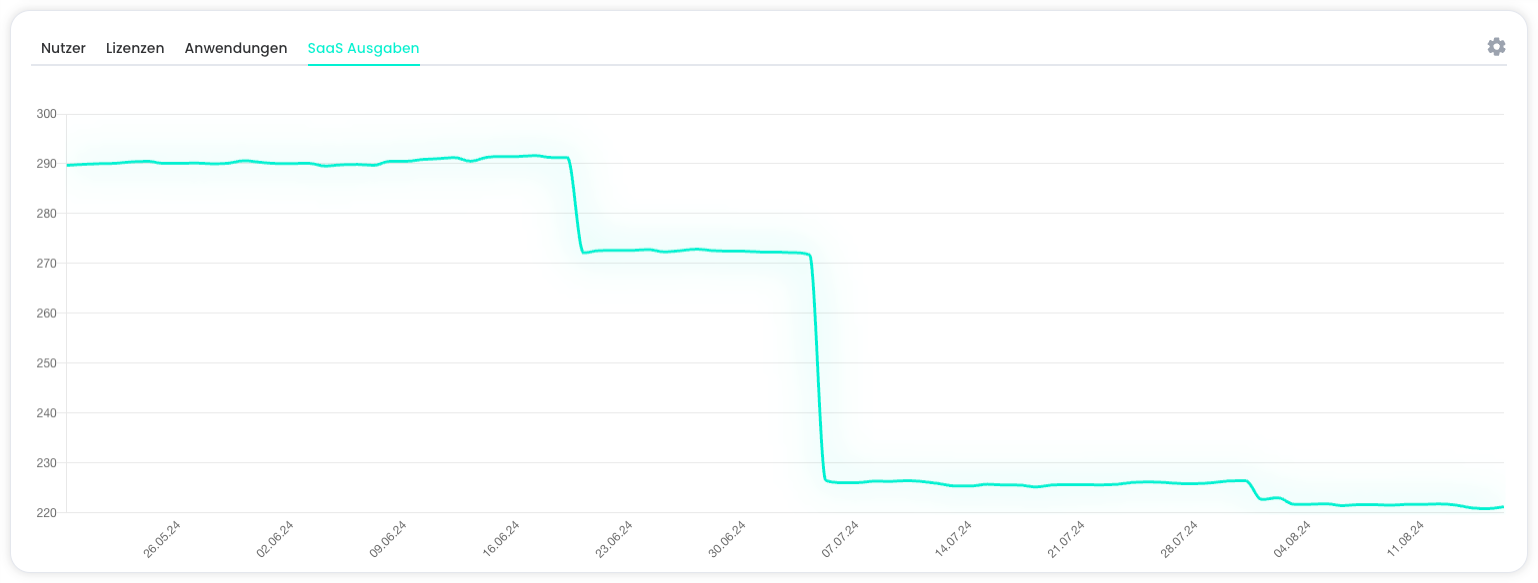
Historic Data
The graphic is updated every 6 hours and provides a clear visualisation of your managed users, licences, applications and SaaS costs.
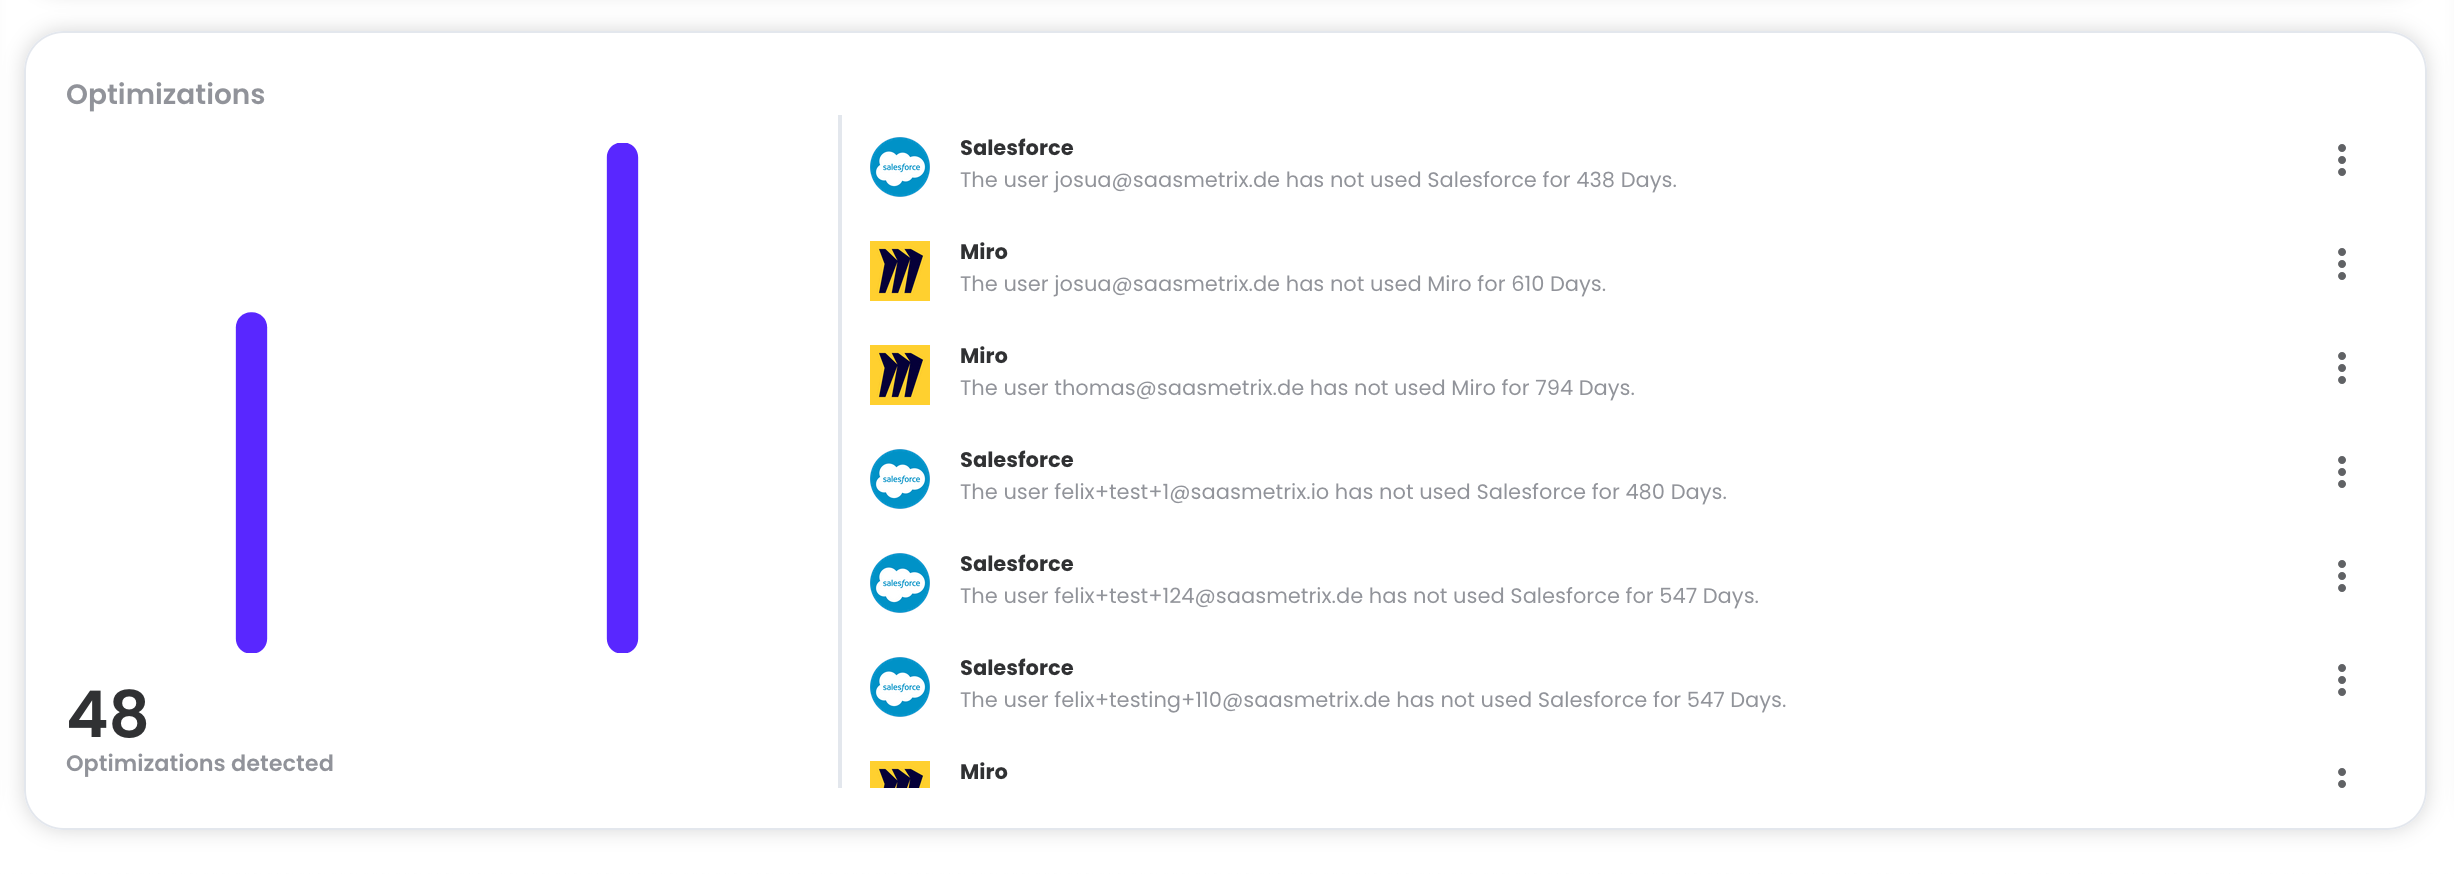
Optimizations
At the bottom of the dashboard you will find all the optimisations detected. The optimisations for all applications are summarised here.
Activity Feed
On the right hand side you will find an overview of the latest activities of all saasmetrix users. This gives you a better overview of the changes made in saasmetrix.